|
The same issue occurs en masse at the broadband provider’s network, where their resources are shared between users on the assumption that they won’t see all of them demanding full speed at the same time: a contention ratio of 50:1 is pretty common, meaning if your neighbours are hammering their connection then it may affect you (assuming you’re on the same provider).
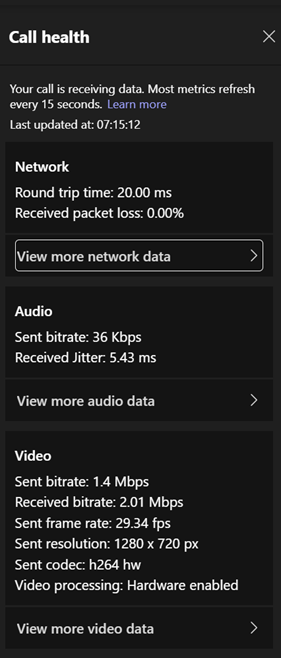
If you’re using Teams or other realtime conferencing tools, it’s arguably more important to look at the latency (or “ping”) and the upload speed, than focussing on the headline download speed; if you have a device uploading lots of data, it might rob your bandwidth and ramp up the latency, which will be the enemy of any kind of synchronous comms. Check your latency over time with an online tool (like TestMy Latency) or download WinMTR to look for spikes in latency. It’s worth making sure your PC isn’t causing issues itself, by running out of memory or pegging out the CPU and therefore giving a poor experience: the topic of looking for poor home network perf has been covered previously in ToW #533 amongst others.
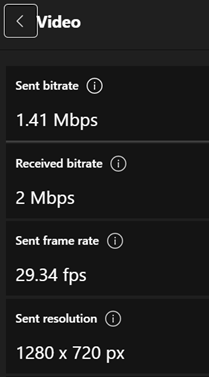
As an end user, see here to understand how to interpret the various data. Hover over the little info icons to the side of each headline to see a bubble explaining in one-line what this is measuring. It’s quite interesting. For admin guidance on what bandwidth and latency requirements you should have to perform acceptably, see here. |
Tag: Performance
603 – Sysinternals @ 25
|
Early and popular tools, which went on to be published on the sysinternals.com website, included RegMon – which monitors what was happening in the Windows Registry – and FileMon, which kept an eye on the file system. Both of these tools could help a user figure out what an application is doing, maybe to check it’s not misbehaving, or seeking undocumented settings where the app might be looking to see if a particular file or registry key existed. Sysinternals made the tools free, and since Winternals was acquired by Microsoft in 2006, they still are.
Despite moving to becoming the CTO for Azure and being a member of the most Technical Fellows, he still has a hand in with Sysinternals, culminating recently in a celebration of the 25th anniversary of the first set of utilities. The day-long virtual conference gave deep dive sessions into a few of the most popular tools, along with an interesting fireside chat with Mark and an overview of Sysinternals tools for Linux. See the recording here. Oh, and one more thing. The Sysinternals Suite is now available in the Windows Store – so you can grab the latest versions of all the core tools (70 of them… yes, that’s right, 70, and for how much?) with just a few clicks. |
533 – Revisiting TaskMgr
|
I’m the Microsoft developer that wrote TaskMgr at home in my den in about 1994 and then the NT silverback devs [ie Dave Cutler] let me check it into the main tree even though I was a greenhorn at the time. So that meant I got to bring it into work and polish it up and make it an official part of Windows, where it remains to this day. Dave tells his career story from a talk a couple of years back, but hit the news recently through a Reddit post from which the italic text above originates. He was inspired to apply to Microsoft in 1993 – having read the Hard Drive book (an excellent historical tome, having inspired at least a few great Microsofties to join up), then went on to write various money-saving optimisations for MS-DOS, and ended up in the NT team, leaving the company 10 years later. Dave also recommends another great history book – Showstopper! Back to the current era, Task Manager is still a really useful tool when it comes to figuring out issues with your Windows PC. If you think something is wrong (app starts bogging down, feels like the PC is in a bad way), you can quickly start Task Manager with the shortcut CTRL+SHIFT+ESC (easy to hit with one hand…)
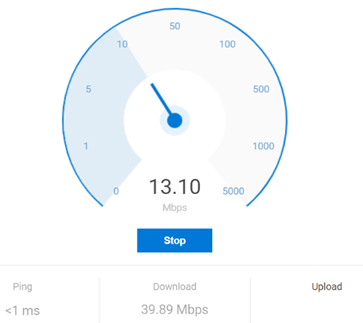
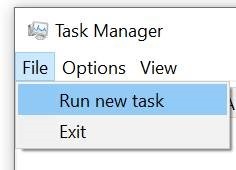
If you can get to Task Manager, you can run a CMD or Powershell prompt, start explorer or msedge etc. Practical Example A colleague pleaded recently that he was having a poor experience with Teams, and queried, did he need to upgrade his 150Mbps internet connection? To check what kind of network performance you’re actually receiving, there are many speed test apps and sites. If you’re using the new Edge (if not, why not? Don’t use IE – it’s too old; stop using old Edge – it’s obsolete; the new Edge is fast and it’s better than Chrome), and you have Bing as your default search engine, all you need do is enter ? speed test into the address bar and you’ll get a speed test gadget to give you an idea of performance.
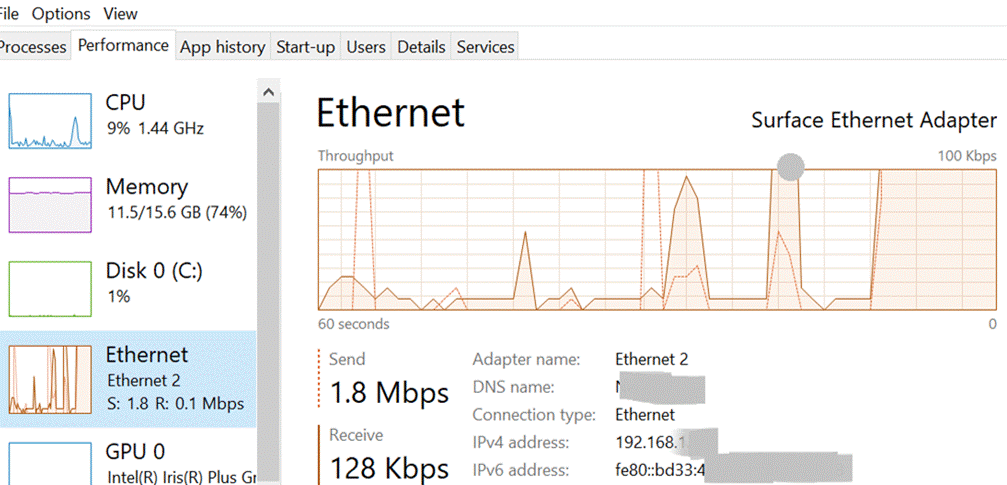
On the Processes tab, click on the CPU column to sort by what’s using the processor most – its also worth casting an eye on some other resources to make sure they’re not running out of steam; if you see an app consuming a huge amount of memory, it might be leaking, and shutting it down completely could make all the difference. Task Manager lets you kill processes (“End Task”) too, if the app has hung and won’t close cleanly. In fact, Dave said there should be nothing that Task Manager can’t kill (apart from some critical system processes – TM might have been able to kill them, but will also bluescreen the machine … so some protection has been added to prevent the user from doing something that would be instantly fatal to Windows – though TM is able to kill itself). Back to the Teams troubleshooting scenario – If you don’t see the PC getting nailed by some process (that isn’t Teams itself), then it’s worth looking at the Performance tab, and leave it running for a short while, paying particular attention to WiFi/Ethernet.
Finally, your network might perform brilliantly most of the time, but every so often you get a blip that feels like it’s dragging, then it picks up again. This could be spikes in latency, the enemy of anything real-time, like video calls. Try running the Microsoft Research Speed Test app – The Network delay is actually key here – if you had more than 1Mbps upload and 5Mbps download speed, that should be plenty – but if your network delay is commonly more than ~150ms, it’s going to start causing problems. If you have a network connection whose latency fluctuates a lot, there are a bunch of things you could do to seek and troubleshoot:
|
Tip o’ the Week 448 – Sometimes, size does matter
|
Nowadays, with 50 or 100GB mailbox quotas being the norm, most Outlook users don’t need to worry about reducing the size of their mailbox other than to keep it from being too hard to use – a tidy mind and all that. But if you have massive mailboxes, the storage and organisation of all your content may put an unnecessary strain on your PC, so it’s worth taking a few steps to check and clean up if you can. In Outlook 2016, go to the File menu and l … and marvel at a dialog box that hasn’t changed since the earliest days of Outlook, evidenced by the fact it measures size in KB rather than MB or even GB… Limits to be aware of There are some recommended limits that have been given to Exchange/Outlook users over the years – not just about the overall size of the mailbox, but the number of items in certain folders and even the number of folders themselves. See a 2005 post on the Exchange blog here, for example, which advises keeping the item count low on certain folders (< 1,000 items in the Inbox, Calendar and Contacts folder was the recommendation then – also on the Exchange Blog, check out some of the examples in this post for early pioneers of huge mailboxes). In more recent versions of Outlook, though, there are some guidelines to avoid performance problems:
Now, you’re probably not going to have too many folders with more than 100k items though it might be worth checking Sent Items and Deleted Items. Unfortunately, the mailbox size tool above shows you the total size of each folder, rather than the number of items – and if you want to know how many folder you have, you’d need to manually count them in the scrolling list box: not an easy task if you have lots of them. It’s quite possible if you’ve had your mailbox for a while, and you’re a very diligent filer (especially if you use a methodology like GTD or tools like ClearContext), you could inadvertently have more than 500 folders – and if you use AutoArchive, then you could find a lot of them are empty, since the archive process moves the items out into another location but leaves the folder structure behind.
FolderCount to the rescue Here’s an interesting little hobby project – a macro-enabled Excel sheet which cycles through all the folders in your mailbox, tells you how many items are in each one and offers to get rid of the empty ones for you. It can be run in:
Use with caution; though anything that is successfully “deleted” will be moved to Deleted Items first, therefore you’ll need to run it again to actually do the damage (or just empty your Deleted Items… a thought that fills some people with dread). To run it, click on the link above, save the file locally, open it up in Excel and you’ll need to Once you’ve done that, click on the appropriate button to let it run. I’d suggest starting with the top one until you feel brave… *The Thread Compressor tool was made available externally after a time, but the domain disappeared… the actual Outlook Addin is again available here, but you’re a bit on your own as far as installing and using it is concerned… |

